Debugging Spectrum Programs
Spectranext includes a powerful integrated debugger that allows you to debug ZX Spectrum programs using GDB or console commands. The debugger supports breakpoints, memory inspection, register access, and stack traces.
Overview
The debugger provides:
- GDB Stub: Connect GDB for full debugging support
- Hardware Breakpoints: Break on specific memory addresses
- Software Breakpoints: Break on code locations
- Memory Inspection: Read/write memory
- Register Access: View and modify CPU registers
- Stack Traces: Inspect call stack
- Source-level debugging: Debug C programs with z88dk-gdb
- All with real hardware!
Compiling with Debug Symbols
To enable source-level (C) debugging, compile your program with the -debug flag:
zcc +zx -debug main.c -create-app -m
This generates debugging symbols that allow GDB to map addresses to source code locations, enabling features like:
- Setting breakpoints by function name or line number
- Viewing variable values
- Stepping through source code line by line
- Viewing source code context
The -debug flag includes debugging information in the output files, which can be used with z88dk-gdb or standard GDB.
Debug Session Examples
Assembly-Level Debugging
You can debug any program at the assembly level, even without debug symbols. This is useful for:
- Assembly programs: Programs written directly in Z80 assembly
- Low-level debugging: Understanding what the CPU is actually executing
- Optimization: Analyzing generated code from compilers
- Reverse engineering: Understanding existing programs
Assembly Debugging Workflow
- Load your program: Load the binary or TAP file (for example, see SDK)
- Set breakpoint: Set breakpoint at entry point or specific address
(gdb) b $8000 - Run to breakpoint: Start execution
(gdb) c - Disassemble current code: See what's executing
(gdb) dis - Step through instructions: Execute one instruction at a time
(gdb) si - Inspect registers and memory: Check CPU state
(gdb) reg - Continue or modify: Resume execution
(gdb) c
Useful Assembly Debugging Commands
View memory in different formats:
(gdb) x $8000 # Hex dump
View stack:
(gdb) stack # View stack contents
Example: Debugging Assembly Code
# Set breakpoint at program start
(gdb) b $8000

# Run program
(gdb) c

# When breakpoint hits, disassemble
(gdb) dis
   0x8000: ld hl, 0x1234
   0x8003: ld de, 0x5678
   0x8006: add hl, de
   ...

# Step through instructions
(gdb) si
(gdb) reg
Assembly-level debugging gives you complete control over the CPU state and allows you to debug any program, regardless of whether it was compiled with debug symbols.
Debugger Architecture
This section explains how the debugger itself functions in otder to serve its function. When the debugger traps (breakpoint hit or stop command), Spectranext remaps memory:
0x0000-0x0FFF   - Debugger 0-page code shadow page
0x1000-0x3FFF   - Unmapped
0x4000-0xFFFF   - Spectrum RAM
The debugger code keeps the Z80 running in a loop until a command is received from the debugger client. So while it might be perceived that Z80 is stopped, in fact it is running a small "halt" routine.
GDB Integration
Spectranext's debugger can be accessed via GDB in several ways:
Connection Options
USB Connection (Recommended)
For debugging on physical Spectranext hardware over USB-C:
The GDB debugger uses the single CDC interface named "spectranext". On macOS, the device appears as /dev/cu.usbmodem* (e.g., /dev/cu.usbmodem00015). On Linux, it's typically /dev/ttyACM0. The interface dynamically switches between console mode and GDB debugger mode based on the protocol detected.
Using z88dk-gdb:
z88dk-gdb -d /dev/cu.usbmodem00015 -x your_program.map
Note: Spectranext exposes a single unified CDC interface that handles:
- Console/Terminal access (default mode)
- File transfer operations (via RSP protocol)
- GDB debugging (automatically switches when GDB connects)
Using z88dk-gdb
z88dk-gdb is a specialized GDB wrapper designed for Z80 debugging. Connect to the debugger:
# USB connection
z88dk-gdb -d <serial_device> -x <link_map>
Parameters:
-d <device>: Serial device path for USB connections (e.g.,/dev/cu.usbmodem00015on macOS,/dev/ttyACM0on Linux - the single CDC interface)-h <host>: Hostname or IP address for network connections (e.g.,192.168.1.100). Useful when debugging with emulators, e.g. FuseX-p <port>: Port number (only required for network connections)-x <link_map>: Path to the zcc link map (e.g.your_program.mapfromzcc-m). z88dk-gdb uses this file, not a separate.symfile.
IDE Integration (CLion)
You can debug Spectrum programs directly from CLion for a full-featured debugging experience with breakpoints, variable inspection, and step-through debugging.
Setup:
- Install z88dk: Ensure you have the latest z88dk installed (part of Spectranext SDK)
- Configure CMake: Use z88dk's CMake toolchain (see example below)
- Create Debug Configuration: Configure CLion to use
z88dk-gdbas the debugger
CLion Debug Configuration:
-
Go to Run > Edit Configurations...
-
Create a new GDB Remote Debug configuration
-
Set the following:
- Name:
Spectranext USB(orSpectranext WiFi) - GDB: Path to
z88dk-gdbexecutable - Target: Your compiled binary
- Symbol file: Your
.mapfile (generated with-debugflag) - 'target remote' args:
- For USB:
/dev/cu.usbmodem00015(or your device path) - For WiFi:
<spectranext_ip>:1337
- For USB:
- GDB startup commands: Leave empty or add custom initialization
- Name:
-
Set breakpoints in your source code
-
Run the debug configuration -
z88dk-gdbwill connect and upload the binary -
The debugger will stop at your breakpoints
Example Project:
See the z88dk-gdb IDE test repository for a complete working example with CLion and VSCode configurations.
Emulators
For debugging in emulators, use the emulator's GDB server:
MAME Emulator:
# Start MAME with GDB stub
mame spectrum -window -nomaximize -resolution0 768x576 -debug -debugger gdbstub -debugger_port 1337

# Connect z88dk-gdb
z88dk-gdb -h localhost -p 1337 -x your_program.map
Fuse Emulator (Windows):
- Start Fuse
- Select "GDBServer..." from the menu
- Select "Enabled"
- Connect z88dk-gdb to the default port
Fuse Emulator (Mac):
- Start Fuse
- Go to "Preferences" > "Debugger"
- Check "Enable GDBServer"
- Connect z88dk-gdb to the default port
IDE Integration
z88dk-gdb can be integrated with modern IDEs for a better debugging experience. See the IDE Integration (CLion) section above for detailed setup instructions.
Visual Studio Code:
- Configure launch.json to use
z88dk-gdb - Set breakpoints directly in the editor
- View variables and call stack in the IDE
- See the z88dk-gdb IDE test repository for VSCode configuration examples
CLion:
- Configure remote debugger to use
z88dk-gdb - Full debugging support with breakpoints and variable inspection
- See the IDE Integration (CLion) section above for detailed setup instructions
z88dk-gdb Commands
z88dk-gdb provides a rich set of debugging commands. Here are the most commonly used commands:
Execution Control
continue/cont/c- Continue executionstep/s- Step one source line (including into calls)stepi/si- Step one instruction (including into calls)next/n- Step one source line (over calls)nexti/ni- Step one instruction (over calls)finish- Exit current function and print result if any
Breakpoints
break/b [address/label]- Set breakpoint at address or labeldelete/d [index]- Delete breakpoint
Memory and Register Inspection
x [address]- Examine memory at addressprint/p <expression>- Print expression valueregisters/reg- Display all registersinfo locals- Show local variables in current frameinfo registers- Show register values
Stack and Frames
backtrace/bt- Show execution stackstack [size]- Examine stack (optionally specify size)frame [num]- Set or view current frameup- Go one frame updown- Go one frame down
Disassembly
disassemble/dis [address] [size]- Disassemble from address (or PC) for size bytes
Source Code
list [address]- List source code around address or current location
Advanced Features
restore <file> [address]- Restore memory from filerestore_pc <file> [address]- Restore memory and set PC – useful for uploading a complete program into ZX spectrum as well as setting the PC at the program's startset <register/address> = <value>- Set register or memory value
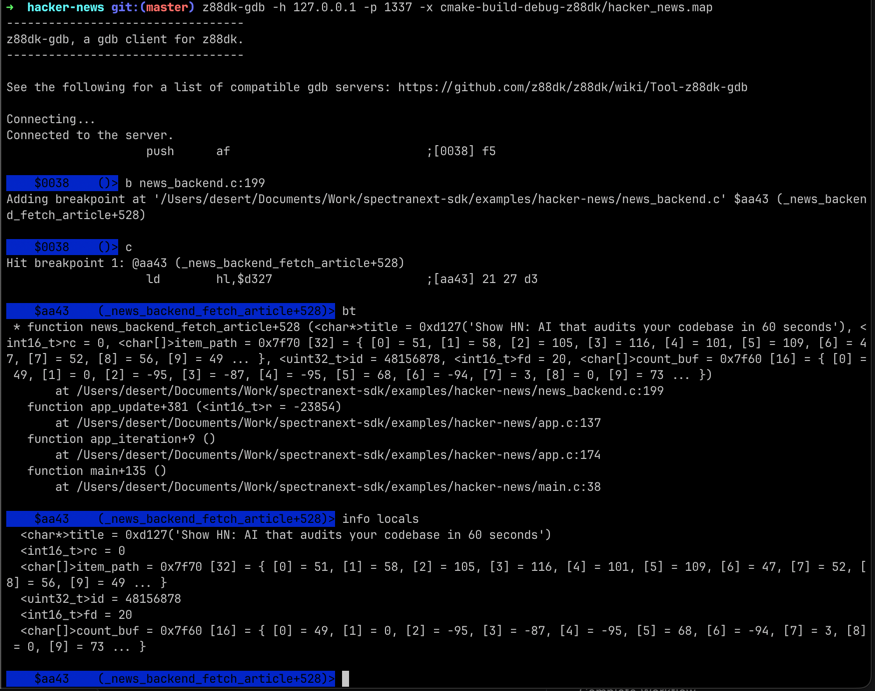
Example z88dk-gdb Session
# Connect to debugger over USB (recommended - single CDC interface)
z88dk-gdb -d /dev/cu.usbmodem00015 -x program.map

# Or connect over WiFi/TCP
# z88dk-gdb -h <spectranext_ip> -p 1337 -x program.map

# Set breakpoint
(gdb) break main

# Continue to breakpoint
(gdb) continue

# When stopped, inspect state
(gdb) info registers
(gdb) print variable_name
(gdb) x/16x 0x8000

# Step through code
(gdb) step
(gdb) next

# View stack
(gdb) backtrace
(gdb) stack 32

# Disassemble
(gdb) dis
(gdb) dis 0x8000 64

# Continue
(gdb) continue
IDE Integration
You can debug Spectrum programs directly from modern IDEs like Visual Studio Code or CLion, providing a full-featured debugging experience with breakpoints, variable inspection, and step-through debugging.
See https://github.com/speccytools/z88dk-gdb-ide-test
Breakpoints
Breakpoint support varies by memory region:
- RAM section (addresses ≥ 16KB): Up to 4 software breakpoints available
- ROM section (addresses < 16KB): Only 1 hardware breakpoint available
Hardware Breakpoints
Hardware breakpoints are implemented by Spectranext monitoring the Z80 address bus in real-time. Spectranext checks for a specific memory address on the bus during memory read cycles. The original instruction at the breakpoint address remains unchanged, so there's no code modification. Only 1 hardware breakpoint is available, but it has no performance impact and triggers immediately when the address matches. Hardware breakpoints work only in the ROM section (addresses < 16KB).
Software Breakpoints
Software breakpoints modify the program code to insert a trap instruction. The instruction at the breakpoint address is replaced with RST $08 (0xCF), and the original instruction is saved and restored when the breakpoint is removed. Up to 4 software breakpoints are available, but they work only in the RAM section (addresses ≥ 16KB).
Example Debugging Session
Complete Workflow
-
Compile with debug symbols:
zcc +zx -debug main.c -create-app -m -
Start debugger target:
- Physical hardware: Ensure Spectranext is running and accessible
- Connect Spectranext to your computer over USB-C or have an active Wi-Fi
-
Connect GDB:
# USB connection (recommended - single CDC interface)
z88dk-gdb -d /dev/cu.usbmodem00015 -x main.map -
Set breakpoints:
(gdb) b main
(gdb) b main.c:20 -
Start/continue execution:
(gdb) continue
(gdb) c -
Inspect state when breakpoint hits:
(gdb) reg -
Step through code:
(gdb) step      # Step into function calls
(gdb) next      # Step over function calls
(gdb) finish # Finish current function -
Continue debugging or exit:
(gdb) continue
(gdb) quit
Limitations
- Limited breakpoints: Only 1 hardware, 4 software breakpoints
- Debug symbols: Source-level debugging requires compiling with
-debugflag, which disables certain program size optimizations.
Additional Resources
- z88dk-gdb Documentation - Complete guide to using z88dk-gdb
- z88dk Debugging Guide - General debugging information for z88dk
- Memory Architecture - Understanding memory layout
- Socket APIs - Network debugging
- Check debugger source code for advanced features